 NASA Earth Observatory
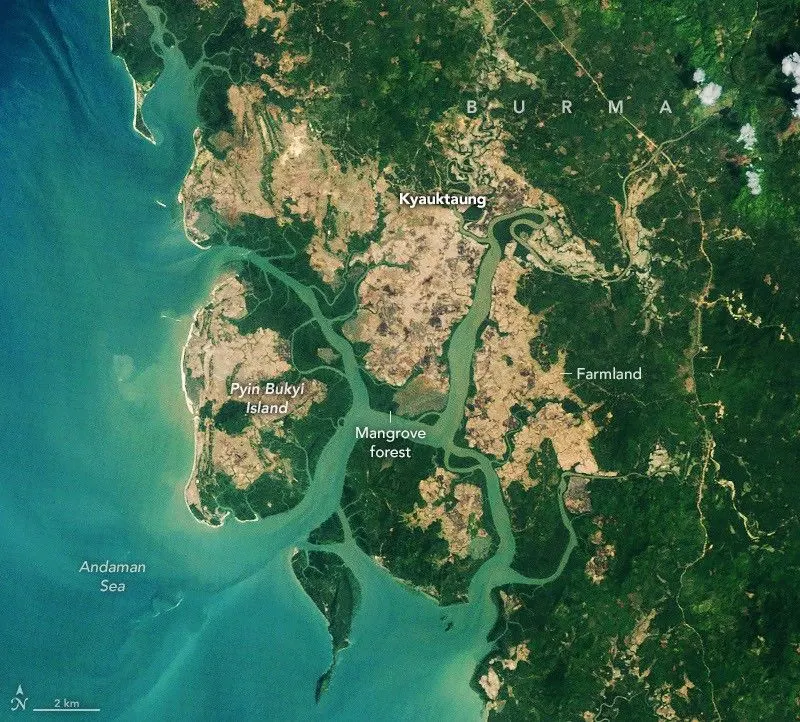
Four decades of Landsat images show heavy losses until 2010, then an increase of nearly 2,000 square kilometers of mangroves, with gains in Asia, Australia and South America.
 Related image · Christopher Bowns / Wikimedia Commons
MIT modeling finds the highest estimated death rates in Midwestern states such as Iowa and Kansas, even though most data center demand sat in Virginia and Texas.
 NASA
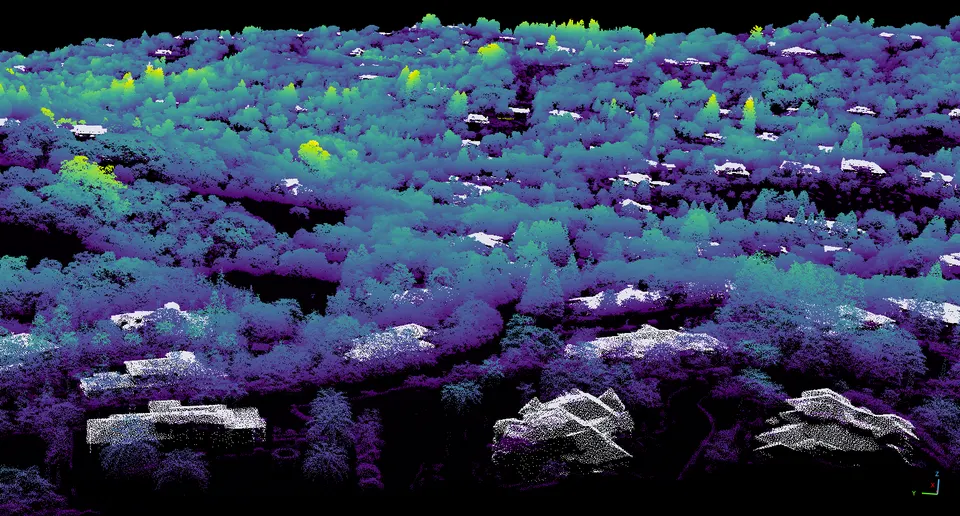
Airborne lidar data from the U.S. Geological Survey went into one statewide map, with each pixel covering a single square meter.
 Related image · Invertzoo / Wikimedia Commons
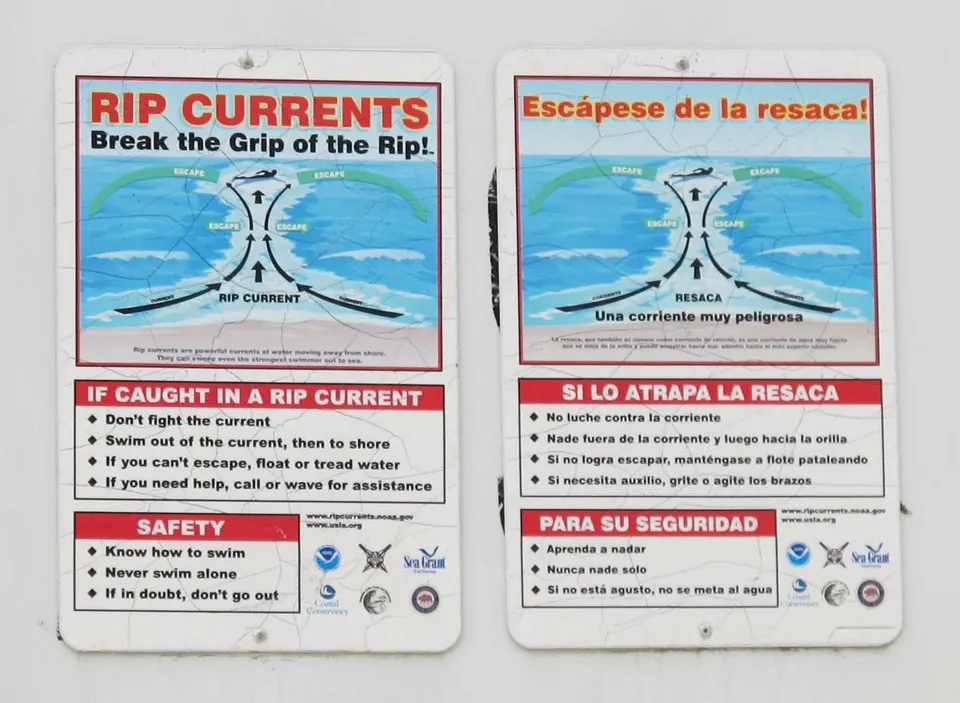
A peer-reviewed paper in Natural Hazards and Earth System Sciences explains how a national-scale forecast of rip currents was developed.
 Related image · NOAA / Wikimedia Commons
A multi-model study finds that greenhouse forcing explains this growing influence better than natural ups and downs do. Aerosols and natural forcings had little effect.
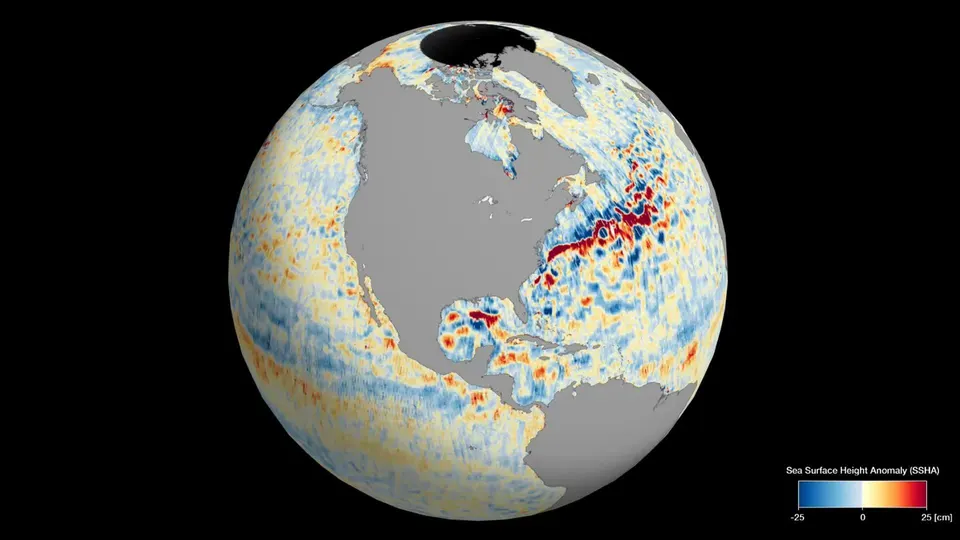 Related image · NASA/JPL-Caltech
Climate simulations point to a mostly one-way link: the Atlantic current may shape Kuroshio temperatures years later, through air circulation around the Arctic.

